Debugging Multi-threaded Java Applications
Stop chasing ghost bugs: Learn how to bring hidden background threads out of the shadows and back into your debugger.
Guide
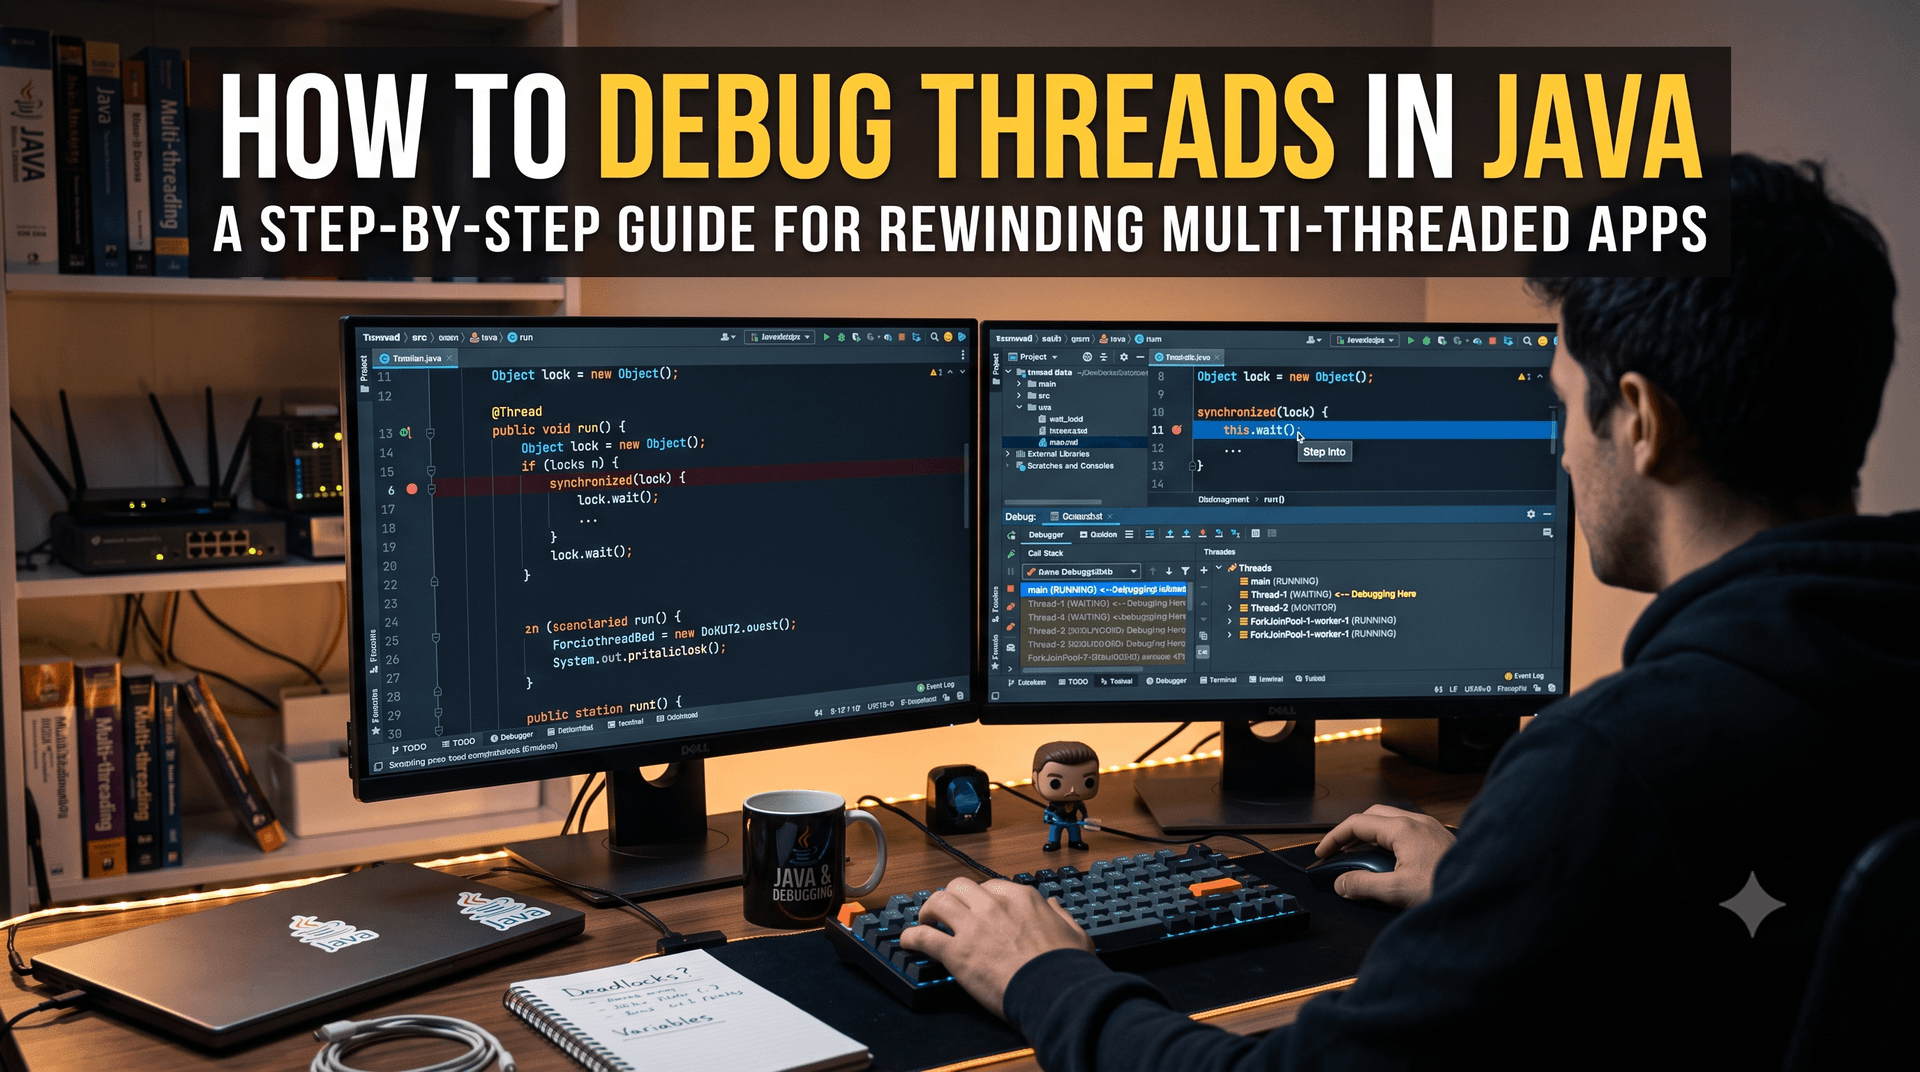
Ever felt like you were chasing a ghost? That's exactly what debugging multithreaded Java applications feels like. You set a breakpoint, you wait, and... nothing. The execution flow has vanished into the background, leaving you staring at an idle main thread while your ExecutorService does its own thing in the shadows.
Multithreading is a powerhouse for performance, but it can be a nightmare for visibility. When execution moves away from the main thread, traditional step-through debugging often breaks down, turning a simple bug fix into a hours-long investigation. In this guide, we'll move past the frustration and show you how to pull those background processes back into the light.
What You'll Learn
- How to effectively set breakpoints for background tasks.
- Techniques for switching thread contexts within your IDE.
- Step-by-step navigation for debugging in Eclipse.
- Pro-tips for thread naming and preventing premature JVM termination.
- How to use thread dumps for post-mortem analysis of hangs and deadlocks.
The Example Scenario
Consider a simple application where we use a fixed thread pool to execute multiple instances of a task. Each task is an instance of a class implementing Runnable:
class executer implements Runnable {
    int id = 0;
    executer(int id) {
        System.out.println("Inside Executer -->>");
        this.id = id;
    }
    @Override
    public void run() {
        Thread.currentThread().setName("D3f4ult_" + id);
        System.out.println("EXECUTER HIT id = " + this.id);
    }
}
public class InterThread {
    public static void main(String[] args) {
        ExecutorService aa = Executors.newFixedThreadPool(5);
        for (int i = 0; i < 5; i++) {
            aa.execute(new executer(i));
        }
        aa.shutdown();
    }
}
Step-by-Step Debugging Tutorial
- Set Your Breakpoints: Always place a breakpoint inside the run() method or the constructor of your task class. Without these, the debugger will likely skip over the thread execution entirely as it finishes in the background.
- Step Into the Constructor: When you start debugging, use "Step Into" (F5) on the line where the task is instantiated. This allows you to verify that the initial state (like the id) is set correctly.
- Switch Thread Context: Open your IDE's Debugger console or Debug view. You will see a list of active threads. In our example, once initialized, you will see threads named "D3f4ult_0", "D3f4ult_1", etc. By clicking on a specific thread name, you can switch your debugging context to that thread's execution stack.


- Execute and Observe: Once inside the run() method of your chosen thread, you can continue execution normally to observe thread-specific outputs in the console.
How to Debug in Eclipse
- Open the Debug Perspective in Eclipse by navigating to 'Window' > 'Show View' > 'Debug'.

- Set your breakpoints in your Java code by double-clicking the left margin next to the line numbers.

- Launch your application in Debug mode by right-clicking your class file in the Package Explorer and selecting 'Debug As' > 'Java Application'.

- When a breakpoint is hit, Eclipse will switch to the Debug view, where you can inspect variables, the call stack, and active threads in the 'Debug' window.

- Use the 'Resume' (F8), 'Step Over' (F6), and 'Step Into' (F5) buttons in the toolbar to navigate through your code execution.

Pro Tips for Thread Debugging
- Naming Threads: As shown in the code, using Thread.currentThread().setName() is invaluable. It transforms generic pool names into recognizable labels, making it much easier to find the right thread in the debug list.
- Don't Let the Main Program End: Be aware that if your main thread completes execution, the JVM may terminate or automatically flush the remaining breakpoints in background threads. Keep the main process active while you are inspecting workers.

Leveraging Thread Dumps for Post-Mortem Analysis
When debugging hangs or deadlocks, sometimes you can't attach a debugger in real-time. In these cases, thread dumps are your best friend. A thread dump provides a snapshot of all threads in the JVM at a specific moment.
- You can generate one by running 'jstack <pid>' from the command line, where '<pid>' is the process ID of your Java application.
- Analyzing these stacks can reveal which threads are waiting on locks or causing circular dependencies (deadlocks).
- Many modern IDEs, including Eclipse, allow you to view thread states directly in the Debug view, but command-line tools offer a more comprehensive look at the entire JVM state.
Video
Code
📋 View the code snippet on GitHub Gist:
👉 https://gist.github.com/HackMEAny/3245397367e400c78599a682fbcc5276
Conclusion
Mastering multithreaded debugging is essential for building resilient, high-performance Java applications. By strategically placing breakpoints, managing your thread context, and leveraging tools like thread dumps, you can transform a chaotic "ghost chase" into a controlled and predictable process.
These techniques not only save hours of frustration but also provide deeper insights into how your code behaves under load. What are your favorite tricks for debugging concurrency? Do you have a "ghost story" of a bug that took weeks to find? Share your tips or experiences in the comments below!